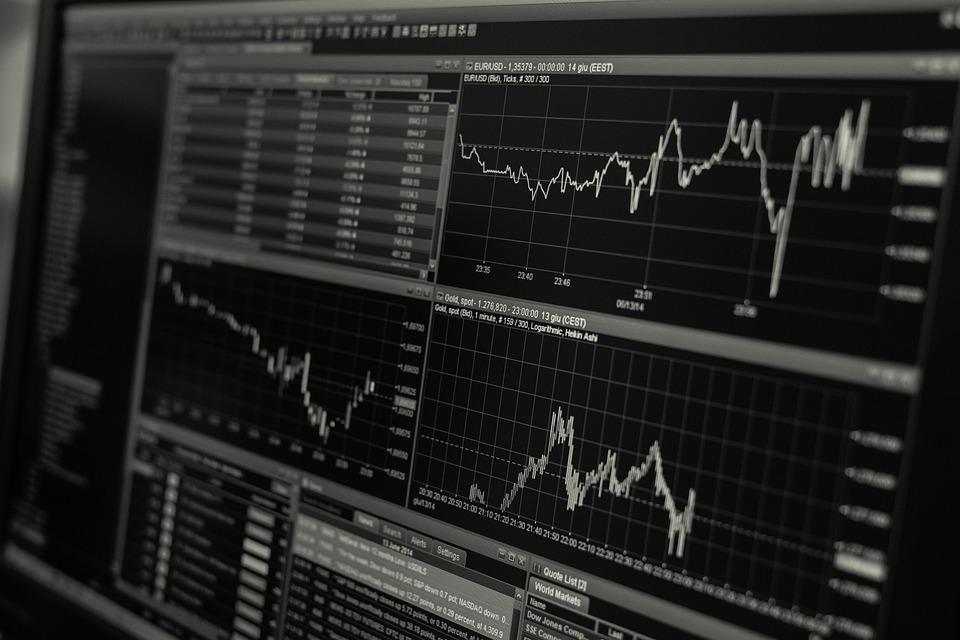
Trading indicators are your lifeline in the bustling world of finance. Understanding these essential tools can make the difference between profit and loss, clarity and confusion. Whether you’re a seasoned trader or just starting out, knowing which indicators to rely on can empower you to make informed decisions that align with your trading strategy. Let’s dive into the seven essential trading indicators every trader should know.
Contents
What Are Trading Indicators?
Trading indicators are mathematical calculations based on the price, volume, or open interest of a security. They help traders evaluate market trends, identify entry and exit points, and forecast future price movements. Mastering them is not just about numbers; it’s about understanding market psychology and making strategic choices.
Why Trading Indicators Matter
You might wonder why trading indicators are so crucial. Here’s the truth: they can simplify complex data and provide valuable insights. With the right indicators, you can:
- Spot trends early: Identify bullish or bearish trends to maximize your gains.
- Time your trades: Know when to enter or exit a position.
- Reduce uncertainty: Gain confidence in your trading decisions.
Let’s explore the seven essential trading indicators that can elevate your trading game.
1. Moving Averages
Moving averages are the bread and butter of technical analysis. They smooth out price data to help you identify trends over a specific period.
Types of Moving Averages:
- Simple Moving Average (SMA): Calculates the average price over a set time frame.
- Exponential Moving Average (EMA): Gives more weight to recent prices and reacts faster to price changes.
Why Use It?
Moving averages help you determine the direction of the trend. A rising SMA indicates a bullish trend, while a falling SMA suggests bearishness.
2. Relative Strength Index (RSI)
The Relative Strength Index (RSI) is a momentum oscillator that measures the speed and change of price movements. It ranges from 0 to 100, helping you identify overbought or oversold conditions.
- Overbought: RSI above 70
- Oversold: RSI below 30
Why Use It?
By spotting potential reversals, you can make timely decisions. If the RSI hits 70, consider taking profits or looking for selling opportunities. If it dips below 30, it might be time to buy.
3. Moving Average Convergence Divergence (MACD)
MACD is a trend-following momentum indicator that shows the relationship between two moving averages of a security’s price. It consists of:
- MACD Line: The difference between the 12-day EMA and the 26-day EMA.
- Signal Line: The 9-day EMA of the MACD Line.
Why Use It?
Crossovers between the MACD and Signal Line can indicate potential buy or sell signals. When the MACD crosses above the Signal Line, it’s a bullish signal; when it crosses below, it’s bearish.
4. Bollinger Bands
Bollinger Bands consist of a middle band (the SMA) and two outer bands (standard deviations above and below the SMA). They help you gauge market volatility.
- Narrow Bands: Indicate low volatility (potential for a breakout).
- Wide Bands: Indicate high volatility.
Why Use It?
Bollinger Bands can help you identify overbought or oversold conditions. When prices touch the upper band, it may signal a sell opportunity, while touching the lower band may indicate a buy.
5. Volume
Volume is the number of shares or contracts traded in a security or market during a given period. It’s a crucial indicator of strength behind a price movement.
Why Use It?
High volume often confirms a trend. If a stock is rising on high volume, it’s likely more sustainable than if it’s rising on low volume. Low volume can indicate a lack of interest, making the trend less reliable.
6. Fibonacci Retracement Levels
Fibonacci retracement levels are horizontal lines that indicate potential support and resistance levels based on the Fibonacci sequence. Traders often use them to pinpoint potential reversals.
Why Use It?
These levels can help you identify where the price might bounce or reverse. Common retracement levels include 23.6%, 38.2%, 50%, 61.8%, and 100%. They’re not foolproof but can add another layer of strategy to your trades.
7. Average True Range (ATR)
The Average True Range (ATR) measures market volatility. It shows how much an asset moves on average during a specific period.
Why Use It?
Knowing the ATR helps you set your stop-loss orders effectively. A high ATR suggests greater volatility, while a low ATR indicates a calmer market.
How to Effectively Use Trading Indicators
Now that you understand the essential trading indicators, how do you put them into practice?
Develop a Trading Plan
- Combine indicators to create a robust strategy.
- Don’t rely on a single indicator; use a mix to confirm signals.
Stay Informed
- Keep up with market news and economic events.
- Use reputable sources like Investopedia, Yahoo Finance, and MarketWatch.
Practice Makes Perfect
- Use a demo account to test your strategies without risking real money.
- Refine your approach based on what works and what doesn’t.
Bottom Line
Trading indicators are essential tools that can pave your path to success in the financial markets. By mastering these seven essential trading indicators, you empower yourself to make informed decisions, spot trends, and navigate the complexities of trading with confidence.
Don’t hesitate to explore these indicators further and integrate them into your trading strategy. Remember, knowledge is your most potent ally in the trading arena.
Ready to take your trading to the next level? Get started today!
FAQs
What is the best trading indicator for beginners?
Moving Averages are great for beginners as they provide a clear picture of trends.
Can I rely solely on indicators for trading?
While indicators are helpful, they should complement your overall trading strategy, including market research and risk management.
How do I choose the right indicators for my strategy?
Consider your trading style – scalping, day trading, or swing trading – and select indicators that align with your goals and risk tolerance.


